In October 2013, Jason Goldberg sent a memo to his employees at Fab.com. The company had 14 million members. It had just closed a $150 million Series D at a valuation above $1 billion. It had a $200 million revenue run rate. By any conventional measure, it was a rocketship.
The memo said this: "We spent $200M and we have not proven that we know precisely what customers want to buy."
Fab had dashboards. Fab had data. Fab had one of the most-watched growth stories in e-commerce at the time. What it did not have was a measurement architecture built around the question that actually mattered: are customers coming back without being paid to do so?
The answer was no. It had been no for a long time. The retention data was sitting in the same systems as the acquisition data. The team just wasn't reading that chapter. They were reading the chapter where the numbers looked good.
By 2014, Fab had gone from 700 employees to 200. The company was eventually acquired for a fraction of its peak valuation. It had spent $40 million on marketing in 2013 alone, roughly 35% of total revenue, to paper over a churn problem the acquisition metrics were successfully hiding.
The problem is not that you lack data
When I come into an early-stage B2B company, the first thing I almost never find is a shortage of metrics. What I find instead is a dashboard built to confirm the story the founding team is already telling. Traffic numbers that look impressive but are not segmented by whether the visitors match the ICP. MQL volume reported to the board as evidence of marketing health, where the MQL definition includes anyone who downloaded a content asset. Free user engagement data being used to prioritize the product roadmap, when free users are the least reliable signal about what paying buyers actually need.
The data is there. The architecture around it is pointed in the wrong direction.
The question is not whether you are measuring. It is whether you are measuring in a way that can tell you you are wrong.
This is not a character flaw. It is a documented feature of human cognition called confirmation bias: the tendency to search for, interpret, and recall information that confirms what you already believe, while discounting evidence that contradicts it. Behavioral scientists describe it as a fundamental property of how the brain drives information search. In practice it means founders naturally gravitate toward metrics that make the story look good in the next board meeting, and away from metrics that would require them to change strategy.
Fab's team was not stupid. They were human. They read the numbers that validated the trajectory they were already on, and they moved quickly past the numbers that suggested the trajectory was unsustainable.
The ICP/ACP confusion and why it compounds
There is a specific version of the data misalignment problem that shows up in almost every B2B company I work with past $1M ARR. It starts with a confusion between the ICP (Ideal Customer Profile) and what you might call the ACP, the Average Customer Profile.
The ICP describes the buyer who gets the most value from your product, stays longest, expands their contract, and refers others. The ACP describes who actually bought, which includes off-ICP buyers who responded to broad positioning, churned within 90 days, required four times the support hours, and never referred anyone.
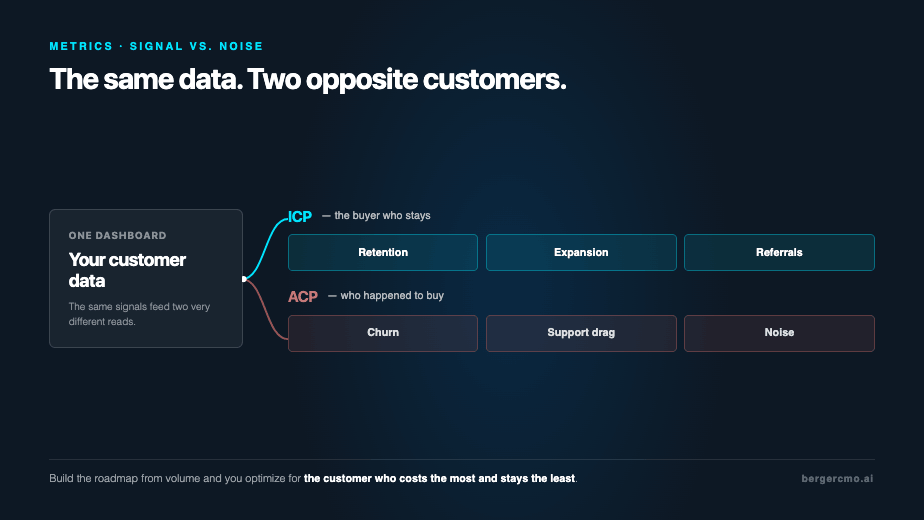
The dangerous feedback loop works like this. The ACP generates the most volume. More customers means more feedback, more feature requests, more usage data. If you build your product roadmap and your messaging from aggregate data, you are optimizing for the ACP. A feature that 80% of off-ICP users want but only 5% of ICP users want looks like a high-priority item on a volume-weighted backlog. It is not. It is a distraction that takes engineering capacity away from the buyers who actually drive your NRR.
The result is a GTM motion optimized for the buyers who cost the most and keep you the least, while the signal from your best customers gets drowned out by the noise from everyone else.
The test that clears the dashboard
There is a simple diagnostic worth running against every metric currently on your dashboard. It is called the "so what" test, and it goes like this: if this number changed by 20% next month, what specific action would you take?
Companies that win focus on seven to ten metrics that actually predict revenue. Most early-stage dashboards have fifty or more. The extra forty are not neutral. They consume attention, generate spurious pattern-matching, and make it easier to tell a story about growth while the real story is hiding in one metric nobody is watching.
Build the measurement around the questions you least want to answer
The antidote to confirmation bias in measurement is not more data and not better tools. It is deliberately designing your measurement architecture around the questions that, if answered honestly, would require you to change what you are doing.
For most early-stage B2B companies, those questions are three. Are the buyers who fit the ICP converting and staying at a rate that justifies the CAC? Are we retaining and expanding revenue from our best customers, or are we replacing churned revenue with new acquisition spend? And is the GTM motion producing the right buyers, or just the most buyers?
Most dashboards cannot answer any of those three questions cleanly. Not because the data is not there, but because the reporting was built to tell the board that marketing is working, not to tell the team whether the right buyers are actually showing up.
Goldberg's memo was not a failure of data collection. Fab had data. It was a failure of measurement architecture. The team built reporting around the metrics that validated the story they were already telling, and they never built the report that would have told them the story was ending.
The data you are not tracking is making decisions for you anyway. The churn rate you are not segmenting by ICP fit is telling you something whether you read it or not. The trial-to-paid conversion rate you are not breaking down by source is shaping your GTM whether you know it or not. The question is whether you find out while you can still change something, or after the $200M is gone.
The hardest part of fixing your measurement architecture is not knowing what to measure. It is rebuilding what you track when the current metrics look fine to your investors, your board, and your team. That alignment problem is real, and it does not resolve itself. It either gets named and worked through deliberately, or it compounds quietly until the gap between what the dashboard says and what the business is doing becomes impossible to ignore.
If you want to know which of your current metrics are actually predicting revenue and which are predicting the story you want to tell, that is a 30-minute conversation worth having before the next planning cycle. That is exactly what a Marketing Audit starts with →